
Master Statistics for Business & Data Science 2026
Learn descriptive statistics, data cleaning, and probability for better business decisions.
Lo que serás capaz de hacer
This course is designed for those who want to apply statistics to make informed decisions in business and data science . It covers foundational concepts necessary to begin your journey in data analysis , business analytics , or any field where data is used to gain insights into the world around us. No prior experience is assumed, and all you need is basic arithmetic and a desire to learn. I simplify statistics to make it accessible, especially if you're new to the field or haven’t applied it in a practical business or data science context. This is an ideal starting point for anyone looking to gain confidence in using statistical methods for problem-solving. The course is practical, hands-on, and focused on showing you how to apply what you learn. Whenever possible, I'll demonstrate how to implement statistical techniques using Microsoft Excel . Key Concepts Covered: Descriptive Statistics – Learn essential concepts like averages, measures of spread and correlation, and more advanced metrics like skewness to analyze and interpret data. Data Cleaning – Master techniques to handle messy data and transform it into meaningful insights. Data Visualization – Understand the best ways to present your data visually, with step-by-step instructions on how to create effective visualizations using Excel. Probability – Learn the core principles of probability , including conditional probability and an introduction to Bayesian statistics . Throughout the course, I'll be available in the Q&A to answer any questions and provide guidance. I aim to support you every step of the way to ensure you get the most out of this learning experience. I look forward to helping you discover how statistics can enhance your decision-making skills!
- Statistics Fundamentals – Understand core statistical concepts and learn how to use statistics for data analysis and data science applications.
- Data Analysis Techniques – Utilize data analysis tools to process and interpret data, extracting actionable insights that support data-driven decision making.
- Data Visualization – Learn to create powerful visual representations using Excel and data visualization tools to communicate data clearly.
- Interpretation of Visuals – Gain the ability to understand, analyze, and comment on data visualization examples to drive insights in business and analytics.
- Cleaning Data – Use statistical methods to clean and prepare data for effective analysis, ensuring your data is ready for accurate reporting.
- Sampling Methods – Learn various sampling techniques, and understand what statistics mean in different contexts to select the right sampling strategy.
Temario
UNIDAD 1 - Introduction · 2 leccionesUNIDAD 1 - Introduction
UNIDAD 1 - Introduction
- Introduction from Woody
- Introduction from Paul Siegel
UNIDAD 2 - Descriptive Statistics · 26 leccionesUNIDAD 2 - Descriptive Statistics
UNIDAD 2 - Descriptive Statistics
- Data for this chapter
- The Mean Average
- The Mean Average - Quiz
- The Median Average
- The Median Average - Quiz
- The Mode Average
- The Mode Average - Quiz
- Comparing Averages
- Comparing Averages - Quiz
- Quantiles, Range and Inter-Quartile Range
- Quantiles, Range and Inter-Quartile Range - Data
- Quantiles, Range and Inter-Quartile Range - Quiz
- Standard Deviation and Variance
- Standard Deviation and Variance - Data
- Standard Deviation and Variance - Quiz
- The Coefficient of Variation
- The Coefficient of Variation - Data
- The Coefficient of Variation - Quiz
- Skew
- Skew - Data
- Skew - Quiz
- Kurtosis
- Kurtosis - Quiz
- Correlation
- Correlation - Data
- Correlation - Quiz
UNIDAD 3 - Cleaning Data · 5 leccionesUNIDAD 3 - Cleaning Data
UNIDAD 3 - Cleaning Data
- Anomalies and Outliers
- Anomalies and Outliers - Data
- Anomalies and Outliers - Quiz
- Coding Data
- Coding Data - Quiz
UNIDAD 4 - Data Visualization · 16 leccionesUNIDAD 4 - Data Visualization
UNIDAD 4 - Data Visualization
- Line Graphs
- Line Graph Assignment
- Bar Charts
- Bar Charts - Quiz
- Dual Axis Charts
- Dual Axis Charts - Assignment
- Pie Charts
- Pie Charts - Quiz
- Histograms
- Histograms - Data
- Histograms - Quiz
- Box Plots
- Box Plots - Quiz
- Cumulative Frequency
- cumulative Frequency - Quiz
- Comparing Visualizations
UNIDAD 5 - Sampling · 6 leccionesUNIDAD 5 - Sampling
UNIDAD 5 - Sampling
- Populations and Samples
- Populations and Samples - Quiz
- Random Sampling
- Random Sampling - Quiz
- Non-Random Sampling
- Non-Random Sampling - Quiz
UNIDAD 6 - Probability · 15 leccionesUNIDAD 6 - Probability
UNIDAD 6 - Probability
- What is Probability?
- What is Probability - Quiz
- Set Notation
- Set Notation - Quiz
- Independent Events
- Independent Events - Quiz
- Mutually Exclusive Events
- Mutually Exclusive Events - Quiz
- Tree Diagrams
- Tree Diagrams - Quiz
- Venn Diagrams
- Venn Diagrams - Quiz
- Conditional Probability
- Conditional Probability - Quiz
- Bayes' Theorem
UNIDAD 7 - Bonus Lecture · 1 leccionesUNIDAD 7 - Bonus Lecture
UNIDAD 7 - Bonus Lecture
- Bonus Lecture
Tu certificado lo emite la SEP, no solo una plataforma
Al demostrar la competencia recibes un certificado emitido por la Secretaría de Educación Pública a través del Gobierno del Estado de México: un documento oficial que puedes presentar con confianza ante cualquier empleador o institución.
Tu certificado con INEC
- Lo emite la Secretaría de Educación Pública (SEP), a través del Gobierno del Estado de México
- Documento oficial con folio verificable en línea
- Lo otorga la Universidad Tecnológica Fidel Velázquez
Otras plataformas en línea
- Constancia privada emitida por la misma plataforma
- Solo acredita horas cursadas o asistencia
- Sin respaldo de una autoridad educativa
Tu itinerario, de la inscripción al certificado
- 1
Inscripción con pago único
Pagas $2,800 MXN una sola vez y entras de inmediato al curso.
- 2
Estudias a tu ritmo
7 unidades con videos, lecturas y actividades, disponibles 24/7 durante 12 meses.
- 3
Cuestionarios por unidad
29 cuestionarios para comprobar lo aprendido.
- 4
Certificado
Emitido por la SEP a través del Gobierno del Estado de México, con folio verificable.
Un certificado oficial de la SEP
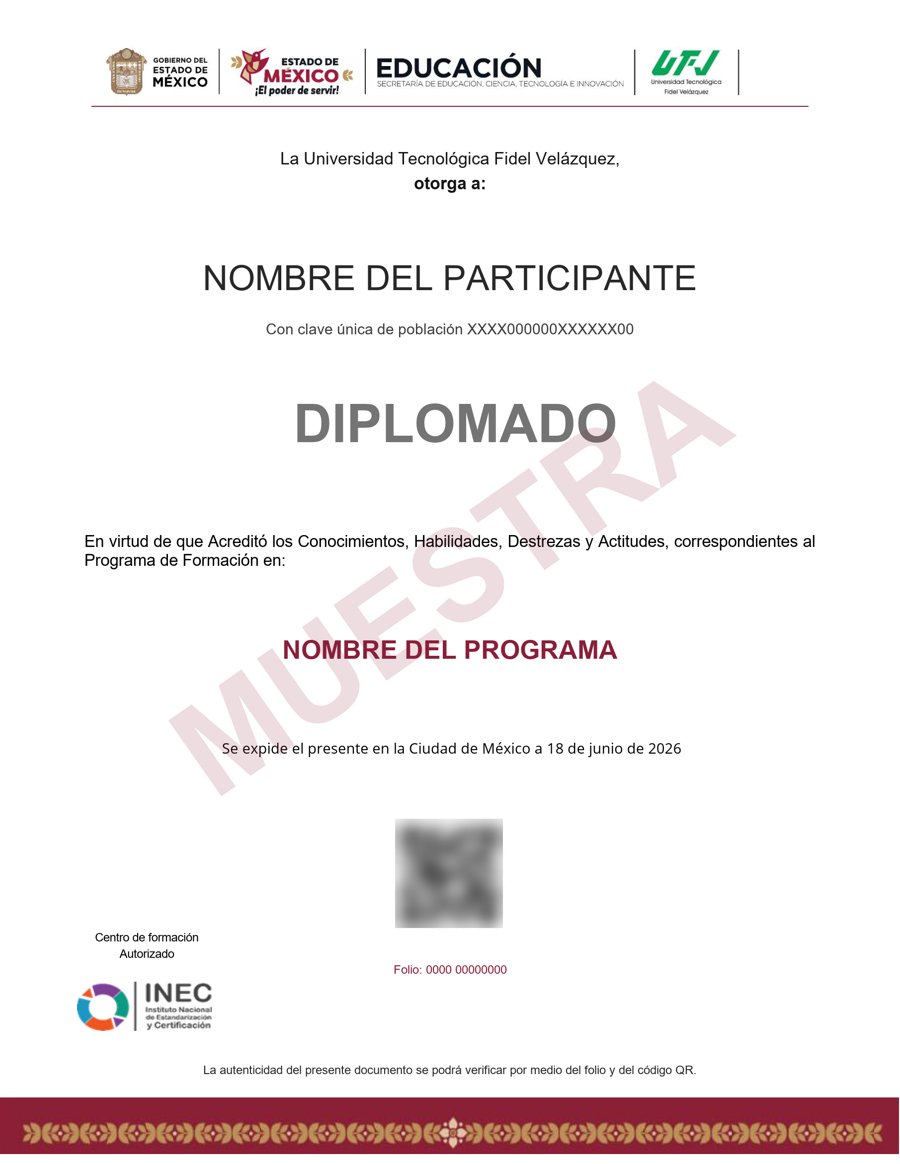
Muestra · verificable por folio y QR
- Emitido por la Secretaría de Educación Pública (SEP), a través del Gobierno del Estado de México. No es una constancia privada: es un documento oficial, y ese respaldo marca la diferencia frente a otras plataformas en línea.
- Contenido impartido por Woody Lewenstein.
- Folio y QR verificables para compartirlo con quien te contrate.
Empieza hoy, a tu ritmo
Un solo pago y acceso inmediato al curso completo durante 12 meses.
- 7 unidades · 71 lecciones · 35 h
- 12 meses de acceso
- 29 cuestionarios de evaluación
- Certificado emitido por la SEP (Gob. del Estado de México) con folio verificable
Sobre tu inscripción
¿Cómo es el pago?
Un solo pago de $2,800 MXN. No hay mensualidades ni cargos recurrentes.
¿Cuánto tiempo tengo acceso?
12 meses desde tu inscripción, 24/7, para avanzar a tu ritmo.
¿Quién imparte el contenido?
El curso es impartido por Woody Lewenstein; INEC gestiona tu inscripción, evaluación y certificado.
¿Qué pasa cuando vence mi acceso?
Puedes renovar tu cuenta tú mismo desde la plataforma, sin trámites ni esperas.

